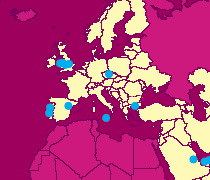
The tables below set out details in relation to our Operating plants and plants under construction as at 9 March 2005

| Fuel/type | Gross capacity power MW |
IPR ownership % |
Net capacity2 power MW |
Gross |
IPR net capacity2 in heat (MWth), desal (MIGD) or steam (million lbs/hr) |
|
|---|---|---|---|---|---|---|
| Assets in operation | ||||||
| North America | ||||||
| Hartwell, Georgia | Gas (OCGT) | 310 | 50 | 155 | ||
| Hays, Texas(1) | Gas (CCGT) | 1,100 | 100 | 1,100 | ||
| Midlothian I and II, Texas(1) | Gas (CCGT) | 1,650 | 100 | 1,650 | ||
| Oyster Creek, Texas | Gas (Cogen/CCGT) |
425 | 50 | 213 | 100 MWth | 50 MWth |
| Bellingham, Massachusetts(1) | Gas (CCGT) | 570 | 100 | 570 | ||
| Blackstone, Massachusetts(1) | Gas (CCGT) | 570 | 100 | 570 | ||
| Milford, Massachusetts | Gas (CCGT) | 160 | 100 | 160 | ||
| EcoEléctrica, Puerto Rico | LNG (CCGT) | 524 | 35 | 183 | ||
| North America total in operation | 5,309 | 4,601 | 100 MWth | 50 MWth | ||
| Europe | ||||||
| EOP, Czech Republic(3) | Coal/Gas | 585 | 99 | 580 | 1,945 MWth | 1,925 MWth |
| ISAB, Italy | Gas | 528 | 34 | 181 | ||
| Pego (Tejo Energia), Portugal | Coal | 600 | 45 | 270 | ||
| Turbogás, Portugal | Gas (CCGT) | 990 | 80 | 792 | ||
| Spanish Hydro, Spain | Hydro | 84 | 67 | 57 | ||
| Marmara (Uni-Mar), Turkey | Gas (CCGT) | 480 | 33 | 160 | ||
| Deeside, UK | Gas (CCGT) | 500 | 100 | 500 | ||
| Derwent, UK | Gas (CCGT) | 214 | 23 | 50 | ||
| First Hydro, UK | Pumped storage | 2,088 | 70 | 1,462 | ||
| Rugeley, UK | Coal | 1,050 | 100 | 1,050 | ||
| Europe total in operation | 7,119 | 5,102 | 1,945 MWth | 1,925 MWth | ||
| Middle East | ||||||
| Al Kamil, Oman | Gas (OCGT) | 285 | 65 | 185 | ||
| Umm Al Nar, (Arabian Power Company), UAE |
Gas (CCGT) /desalination |
870 | 20 | 174 | 162 MIGD | 32 MIGD |
| Shuweihat S1, UAE | Gas (CCGT) /desalination |
1,500 | 20 | 300 | 100 MIGD | 20 MIGD |
| Middle East total in operation | 2,655 | 659 | 262 MIGD | 52 MIGD | ||
| Australia | ||||||
| Canunda, South Australia | Wind | 46 | 100 | 46 | ||
| Pelican Point, South Australia | Gas (CCGT) | 485 | 100 | 485 | ||
| Synergen, South Australia | Various | 360 | 100 | 360 | ||
| Hazelwood, Victoria | Coal | 1,635 | 92 | 1,500 | ||
| Loy Yang B, Victoria | Coal | 1,000 | 70 | 700 | ||
| SEA Gas pipeline, Victoria(4) | n/a | 33 | n/a | |||
| Valley Power, Victoria | Gas (CCGT) | 300 | 42 | 126 | ||
| Kwinana, Western Australia | Gas (CCGT) | 118 | 49 | 58 | ||
| Australia total in operation | 3,944 | 3,275 | ||||
| Asia | ||||||
| Paiton, Indonesia | Coal | 1,230 | 31 | 385 | ||
| Malakoff, Malaysia(3) | Gas (OC/CCGT) | 2,863 | 18 | 529 | ||
| HUBCO, Pakistan | Oil | 1,290 | 17 | 214 | ||
| KAPCO, Pakistan | Gas/Oil (CCGT) | 1,600 | 36 | 575 | ||
| Uch, Pakistan | Gas (CCGT) | 586 | 40 | 234 | ||
| Pluak Daeng (Thai National Power), Thailand |
Gas (Cogen) | 110 | 100 | 110 | 20 MWth | 20 MWth |
| Asia total in operation | 7,679 | 2,047 | 20 MWth | 20 MWth | ||
| TOTAL in operation around the world | 26,706 | 15,684 | ||||
| Assets under construction | ||||||
| Malakoff, Malaysia(3) | Coal | 1,890 | 18 | 349 | ||
| Ras Laffan B, Qatar | Gas (CCGT) | 1,025 | 40 | 410 | 60 MIGD | 24 MIGD |
| Tihama, Saudi Arabia | Gas (Cogen) | 1,074 | 60 | 644 | 4.5m lbs/hr | 2.7m lbs/hr |
| Umm Al Nar Expansion, UAE | Gas (CCGT) /desalination |
1,550 | 20 | 310 | 25 MIGD | 5 MIGD |
| TOTAL under construction around the world | 5,539 | 1,713 | ||||
(2) Net capacity – Group share of gross capacity.
(3) Gross capacity amount shown for EOP and Malakoff represents the actual net interest owned directly or
indirectly by EOP and Malakoff, respectively.
(4) 687 km gas pipeline from Victoria to South Australia.
(5) Turbogás net ownership will reduce to 60% (594 MW) during the first half of 2005.

